Solana DeFi Overview
Key takeaway
Solana DeFi has cooled significantly since the September 2025 peak, with TVL now around $6B, roughly 53% below ATH.
But underneath the slowdown, the ecosystem still looks active and the composition has shifted. Capital is moving away from lending and speculative DeFi, and into structurally stickier categories.
A few things still stand out:
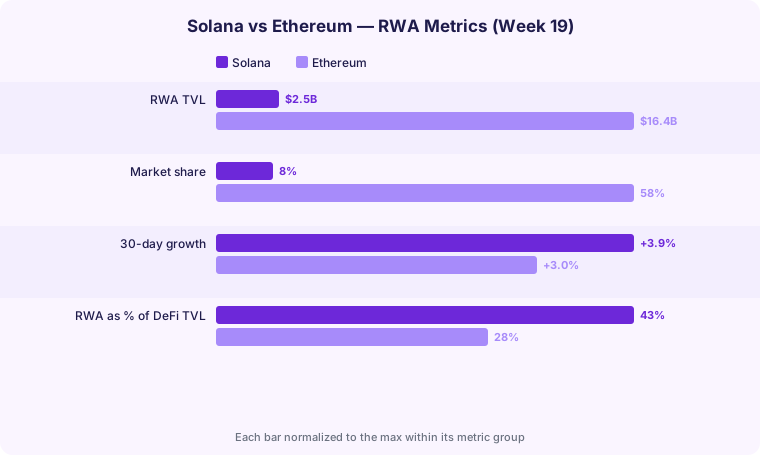
- RWA crossed $2.5B
- SOL ETFs reached roughly $1B cumulative inflows
- Stablecoin liquidity remains above $13B
- The Alpenglow upgrade expected in Q3 2026 is becoming the next major narrative
Rather than capital fully leaving Solana, the market looks more selective and defensive, with RWAs and ETFs becoming the strongest support for the ecosystem.
Where Solana Inflows Are Coming From
Key takeaway
Institutional flows are accelerating even as DeFi activity cools.
One of the strongest signals right now is ETF demand. SOL ETFs crossed roughly $1B cumulative inflows, while BTC also saw a sharp comeback in May with a massive $622M single-day inflow on May 11. Even with DeFi activity slowing down, institutional appetite for crypto still looks strong.
Stablecoins are rotating, not disappearing
Stablecoin liquidity has definitely cooled off since March, but it has not disappeared.
Supply dropped from roughly $15B at peak to around $13B+, with USDC still representing about 75% of the balance. After the Drift exploit, Tether stepped in proposing to help the ecosystem, implying a possible stablecoin dominance shift toward USDT.
The bigger change is that stablecoin capital is becoming more selective. Lower yields and weaker lending opportunities pushed a lot of liquidity away from traditional DeFi strategies. That is very different from a full loss of confidence in Solana itself.
RWA on Solana
Key takeaway
RWA keeps getting bigger, even while the broader market weakened.
| CONTRIBUTOR | TVL |
|---|---|
| Hastra PRIME | ~$322M |
| BlackRock BUIDL | ~$321M |
Growth has slowed compared to last month, but it is still positive even while the broader market weakened.
Simple comparison
ETF Flow Picture
Key takeaway
SOL has built the most consistent ETF inflow trend, and BTC has come back strongly. ETH continues to lag.
| ASSET | FLOW TREND | READ |
|---|---|---|
| BTC ETFs | strongly positive | sharp reversal higher in May |
| ETH ETFs | modest positive | still lagging |
| SOL ETFs | ~$1.08B cumulative | strongest structural trend |
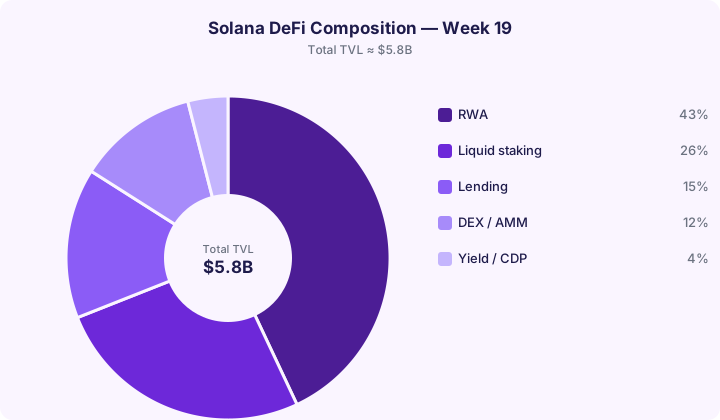
Solana DeFi Composition
Key takeaway
Earlier this year, lending and liquid staking dominated the ecosystem. Today, RWA has become the single largest category by far.
P0 Overview
Executive summary
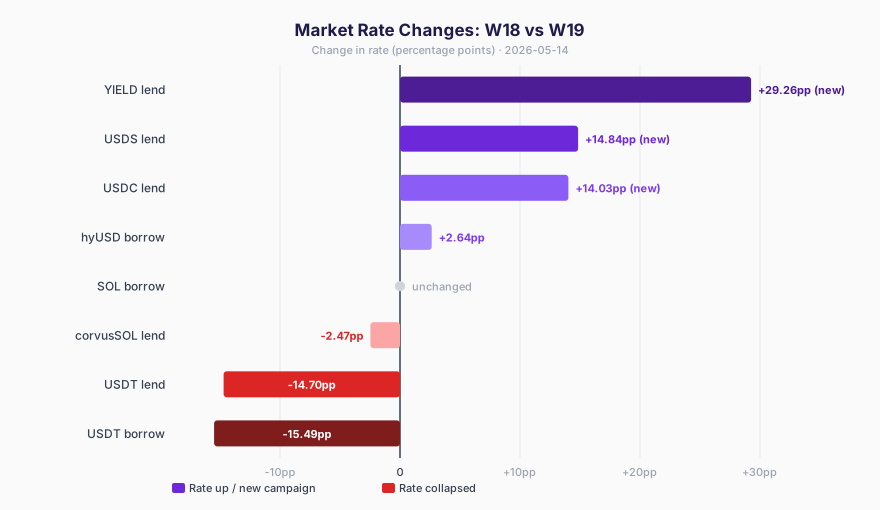
We are now in week 19. All rates below are compared WoW with week 18.
This week confirmed a few important trends:
- USDT spike trades already came back to equilibrium — rates collapsed as predicted
- YIELD became the new dominant campaign structure
- Standard LST looping compressed but spread still positive for more than a month for certain pairs
- The more scalable setups are now directional rather than pure arb
The market still looks active underneath, but the opportunity set is becoming much more selective. Right now the highest yields are tactical, fast-moving, and heavily rate-dependent. The more durable setups are lower yield, but structurally cleaner.
Protocol overview
Key takeaway
The strategy count barely moved, but the entire platform structure rotated underneath.
| METRIC | W18 | W19 | CHANGE |
|---|---|---|---|
| Strategies displayed | 31 | 30 | slightly lower |
| Main structure | USDT + corvusSOL | YIELD + BTC Short | full rotation |
| Dominant yield source | USDT spike | YIELD emissions | rotated |
Market rates
Key takeaway
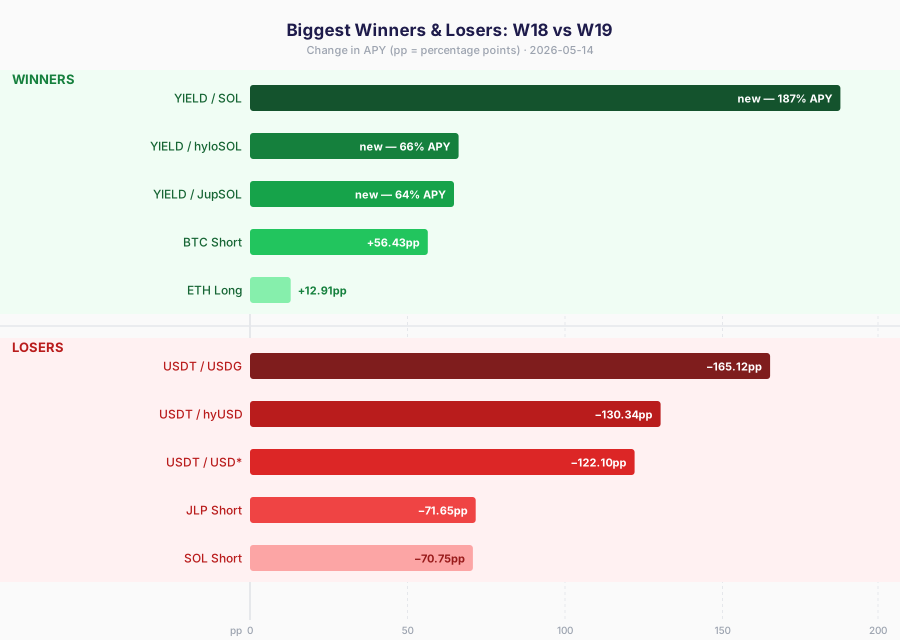
This week basically became the YIELD launch week. The system completely rotated away from USDT dominance into campaign-driven yield farming. At the same time, USDT finally collapsed exactly as predicted.
Biggest rate moves
New market structure
Key takeaway
The market is now separated into four different opportunity buckets.
| BUCKET | APY RANGE | MAIN RISK |
|---|---|---|
| YIELD campaign | 59–187% | campaign ending |
| Stablecoin arb | 46–72% | rates collapsing |
| corvusSOL campaign | 26–81% | emission decay |
| Directional trades | 24–119% | funding rotation |
Interpretation
- YIELD campaign trades now dominate absolute APY
- BTC Short became the strongest scalable directional trade
- corvusSOL trades still work, but are clearly decaying
- traditional LST emode trades are basically gone
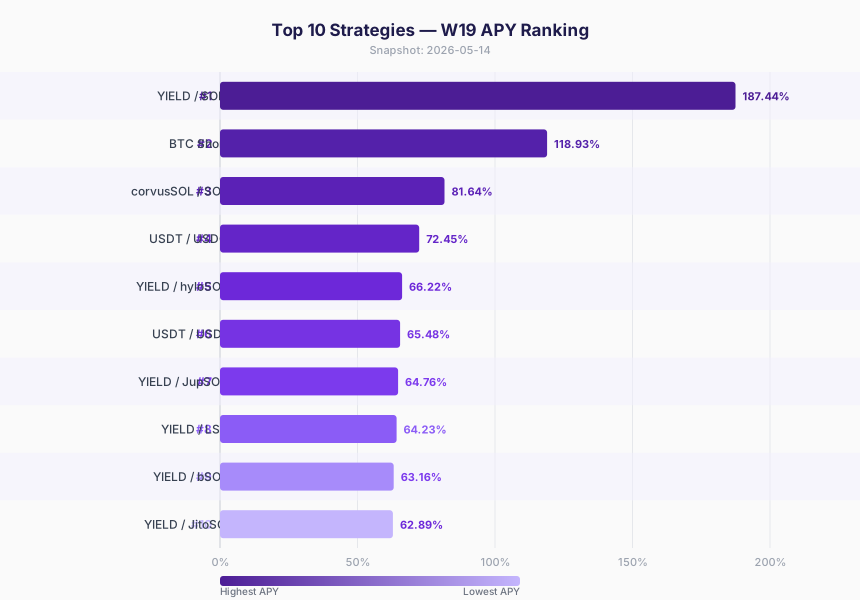
Top strategies
Key takeaway
YIELD completely took over the leaderboard.
Read
- YIELD campaign strategies took 6 of the top 10 spots
- BTC Short jumped from rank 9 to rank 2
- corvusSOL/SOL is still alive but clearly decaying
Directional strategies
Key takeaway
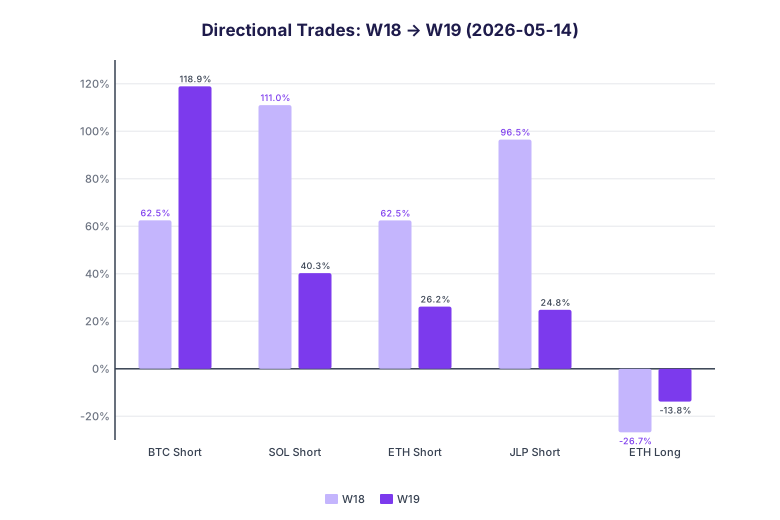
Directional trades became more important this week. BTC Short became one of the strongest structures on the entire platform.
Read
- BTC Short is now the best directional trade on the platform by APY
- SOL Short lost yield but remains the best scalable opportunity by liquidity
- ETH Long improved slightly but still remains structurally negative
YIELD campaign
Key takeaway
YIELD / SOL is the highest APY on platform. The strongest setups in the cluster offer a combination of high yield and manageable borrow cost.
| STRATEGY | WHY IT STANDS OUT |
|---|---|
| YIELD / SOL | highest APY on platform |
| YIELD / hyloSOL | cheapest borrow cost |
| YIELD / JupSOL | best liquidity + yield balance |
Standard LST emode
Key takeaway
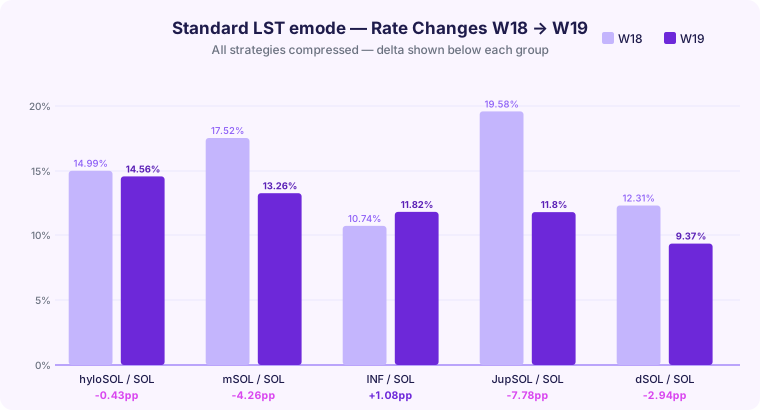
Traditional LST looping got weaker this week and effectively disappeared from active strategies.
Rising SOL borrow costs hurt almost every high leverage strategy. JupSOL saw the sharpest deterioration, while INF was the only setup that actually improved. Right now, hyloSOL and mSOL look like the strongest standard emode structures overall.
Winners and losers
Liquidity reality
Key takeaway
The highest APY trades are no longer the largest deployable trades.
| STRATEGY GROUP | APY | LIQUIDITY |
|---|---|---|
| YIELD campaign | 59–187% | low–medium |
| BTC Short | 119% | $11.6M |
| SOL Short | 40% | $43.9M |
| Stablecoin arb | 46–72% | low-medium |
| corvusSOL campaign | 26–81% | medium |
| STKESOL / SOL | 8.96% | $800k |
The best scalable setups right now are probably BTC Short, SOL Short, larger YIELD pairs, and corvusSOL / SOL.
The highest APY setups remain tactical and fast-moving. The cleaner long-duration trades are now mostly lower yield.